Problem
What is the total population of fish in the pond containing both tagged and untagged fish?
Hypothesis
The total amount of fish in the pond will be 135.
Procedure
- Obtain a bowl with your fish.
- Do NOT count the number of fish in your pond yet!
- Have one member of your group remove a large handful of fish.
- Count the number of fish you just removed and write it in the table below.
- Replace these fish with “tagged” fish (in this case, colored “fish”)
- Mix your pond well to redistribute the tagged fish among the other fish.
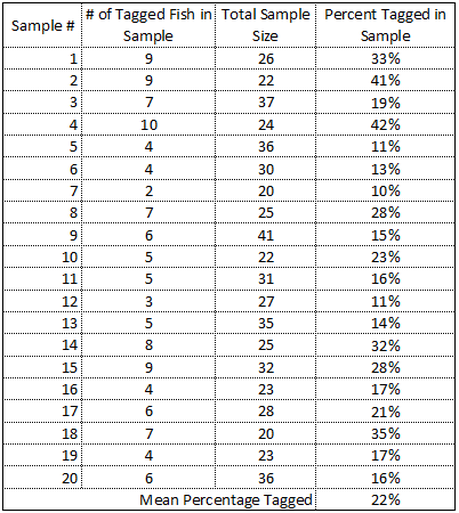
- One member at a time (and without looking), remove a handful of fish and record the number of total fish in the sample, the number of tagged fish, and figure out the percentage of tagged fish. (see chart)
- Return your handful to the bowl!!
- Continue with this until you have taken 20 samples.
Parts of the Experiment
Independent Variable: Number of fish in population
Dependent Variable: Accuracy of tagging
Controlled Variables: Replacement of fish, goldfish, bags, number of trials
Control Group: 100% accuracy group
Experimental Group: Bags in lab
Dependent Variable: Accuracy of tagging
Controlled Variables: Replacement of fish, goldfish, bags, number of trials
Control Group: 100% accuracy group
Experimental Group: Bags in lab

Sample 15
Data Table
Lab Questions
1. The mean of the percent tagged fish from the 20 samples is 22 percent.
2. Population Size = (30/22.1) x 100 = 135
The estimated population of the pond is 135.
3. The actual number of fish in the bowl is 120.
4. Percent Error = 100 x (135 - 120) / (120) = 12.5%
The percent error is 12.5 percent.
5. This method appears to be an effective way to assess population size because the percent error was smaller than 15 percent. Also, it seems to be the most efficient way to gague the population size considering that each fish cannot be physically counted.
6. A biologist should be aware of the tendency of a species to migrate and the conditions in which they will migrate from their habitat before using this method to approximate the size of the population. Reproduction habits should also be considered to obtain a more accurate population size. Otherwise they may retrieve mixed results during different weather conditions.
General Analysis & Conclusions
Evaluation of Hypothesis: My hypothesis was incorrect but it was not far from the actual number of fish in the pond. The percent error was 12.5 percent and my hypothesis was a good representation of the pond's population.
Accuracy of Results: The accuracy of the results may be distorted based on certain factors that change between each sample collection. The amount of fish that are collected in one handful may have a large enough difference each time to affect the accuracy of the data. The lab encountered a 12.5 percent error which may have been lessened if the sample sizes were more evenly distributed.
Application: Fish tagging can be practiced by biologists not only to approximate population size but to gain other information like migration patterns and the growth of the population. Biologists tag fish with three different marking methods: biological marks, chemical marks, and physical marks. Physical marks have the disadvantage of increasing the chance of morality in the fish that is marked which can be counterproductive towards the efforts of the biologists. Chemical marking can help tag a large amount of fish at once and increase the speed and area in which data is received. There are multiple methods to marking fish and each have advantages and disadvantages that biologists must consider before beginning experimentation.
Citation: "Fish Tagging and Marking Techniques." Arizona Game and Fish Department. N.p., n.d. Web. 13 Mar. 2013
